Signs of Trust: Matching Real-World Performance with PD Replica Sim

Can machine learning teams really trust that performance seen in simulation will translate to the real-world? Simulation offers a host of benefits—it’s faster, less expensive, safer, and allows for testing at scale, as well as the exploration of scenarios that would be impractical or dangerous in real-world settings. However, if simulation performance does not reliably translate to real-world performance, then the simulated results could be misleading, or worse, create a false sense of security.
Bridging the Reality Gap with PD Replica Sim
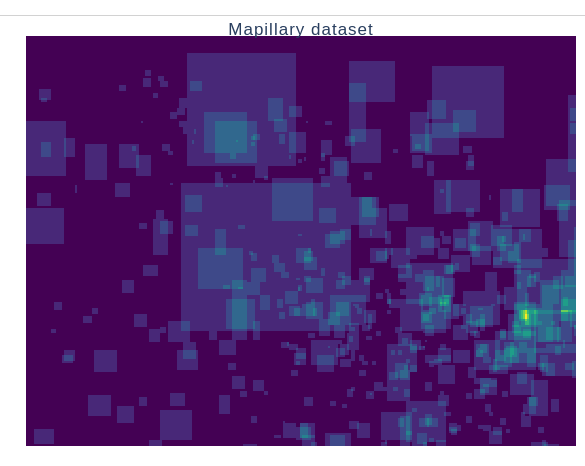
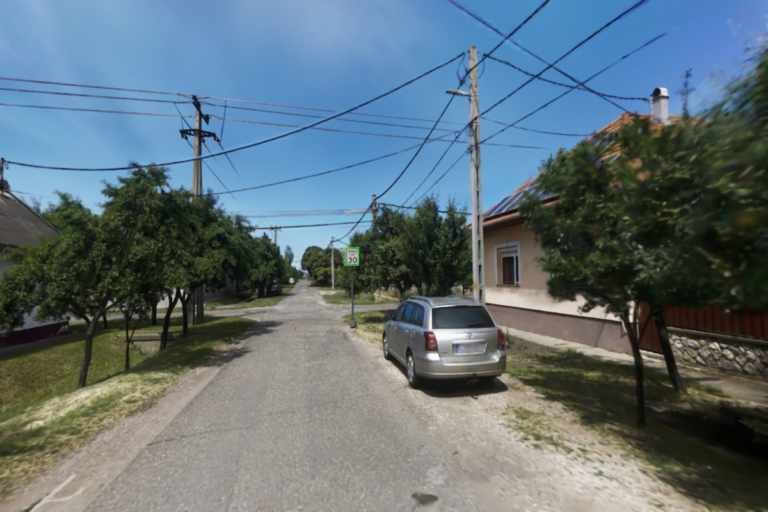
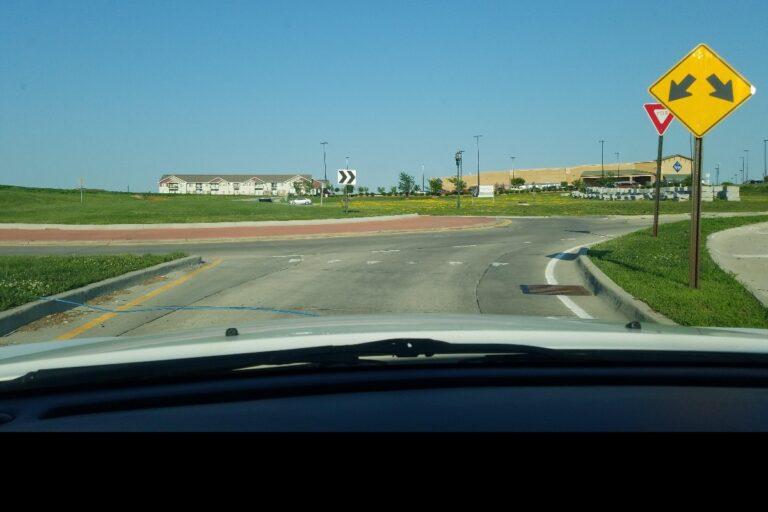
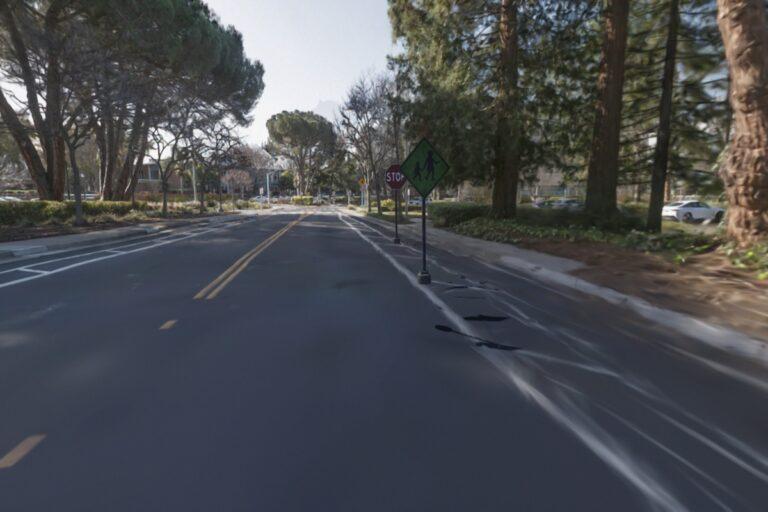
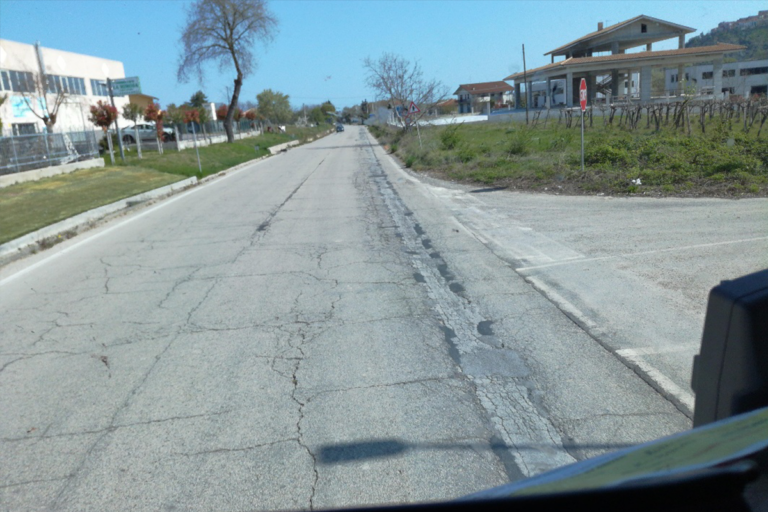
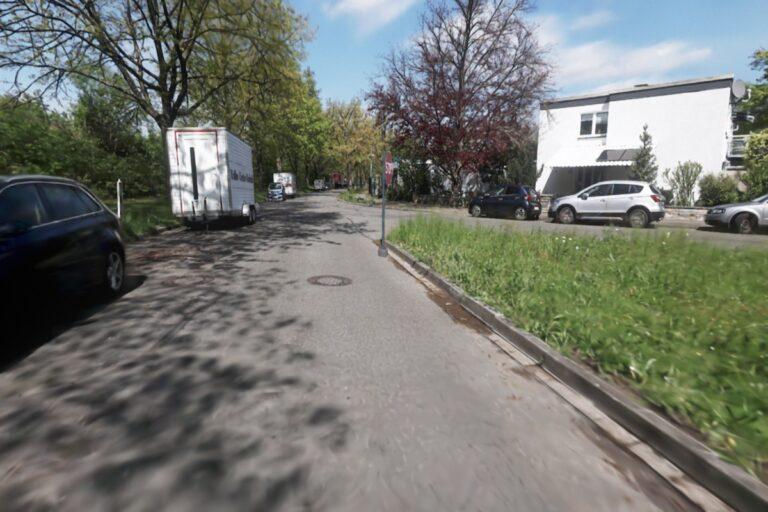
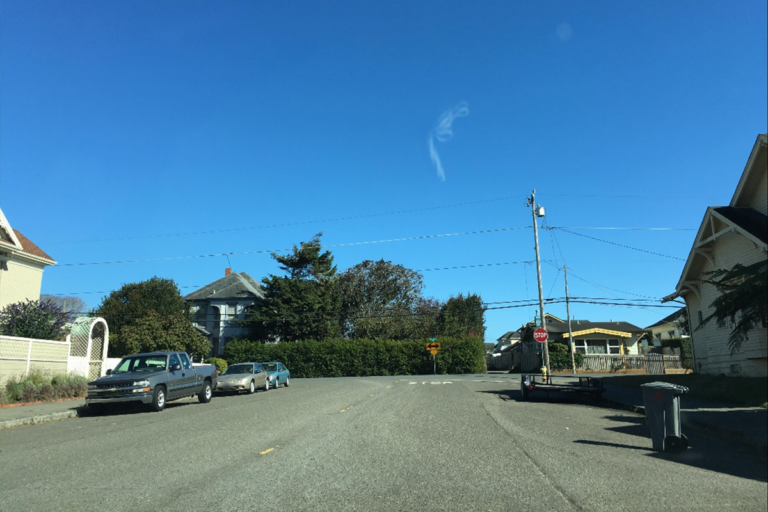
To close the gap between simulation and the real-world, we introduced PD Replica Sim in 2024. PD Replica locations are 3D digital twin simulation environments generated from real camera data. These images can come from customer drive logs, or independent captures. By running simulations in these accurately modeled locations, we gain all the advantages of programmatic simulation—such as generating new scenarios with dynamic agents—while retaining the complexity and nuance of real-world environments.
To evaluate the effectiveness of PD Replica Sim compared to real-world data, we have been conducting ongoing, original research. Our initial study focused on parking spot detection, where we demonstrated that models operating in PD Replica environments outperformed those in procedural simulation. Building upon that success, we now present our latest results on the programmatic addition of synthetic objects into PD Replica simulations. In this phase, we inserted 3d traffic signs into the simulation to test how well the added elements represent and challenge the model, further validating PD Replica Sim’s capability to mirror real-world scenarios.
Experiment Setup and Methodology
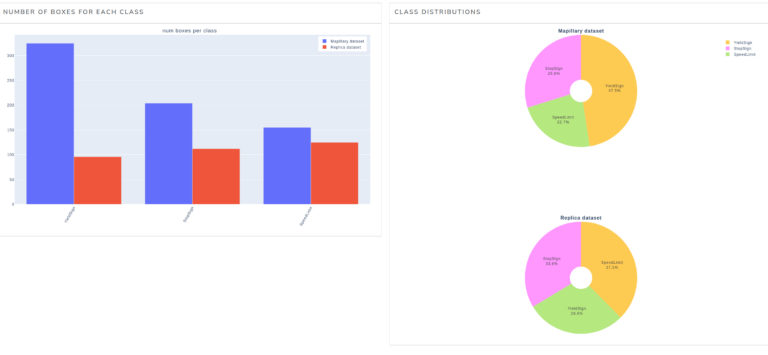
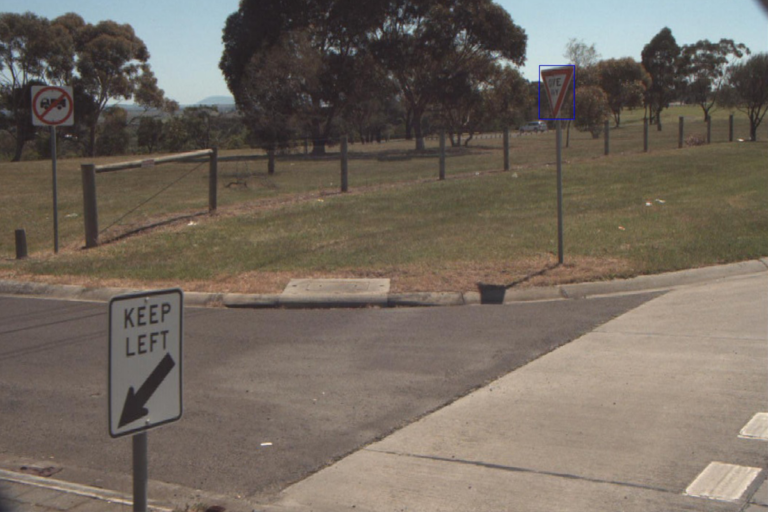
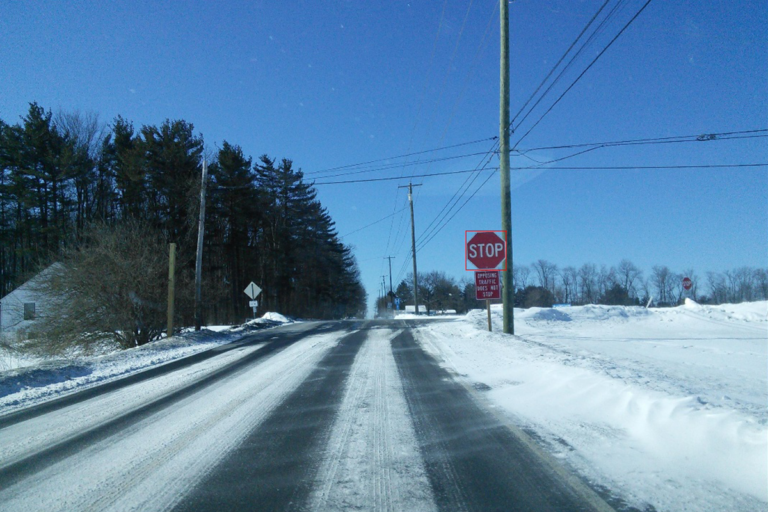
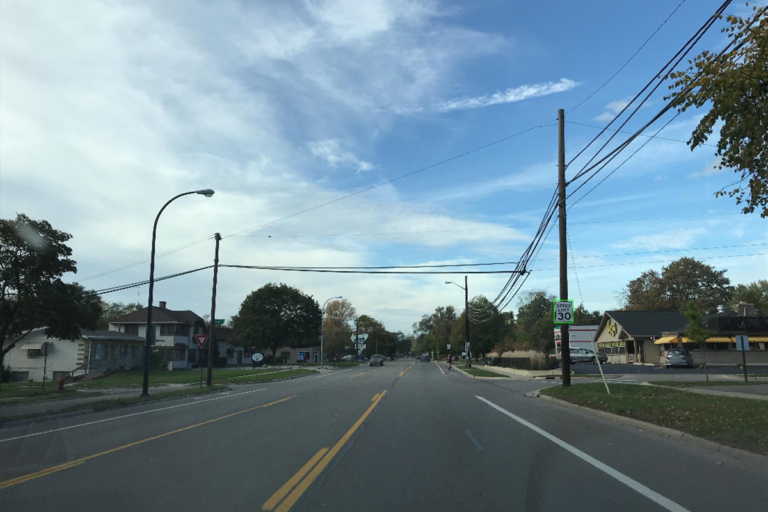
We used an FCOS-r50 model trained on real-world images from the Mapillary Traffic Sign dataset. For validation, we generated a dataset using PD Replica Sim, targeting three common sign types across European and North American geographies: Yield, Stop, and Speed-limit.

The primary objective was straightforward yet ambitious: determine whether the performance observed on the PD Replica Sim dataset would closely mirror those obtained from the real-world dataset. We assessed the mean average precision (mAP) between the datasets across subclasses, and analyzed the failure cases of the model. Matching results across these attributes provide compelling evidence that our simulation environment is not only generating realistic images but also capturing the nuances and challenges inherent in real-world traffic sign detection.
PD Replica Mirrors Real-World Performance for traffic sign detection
The initial results of our study were both striking and encouraging. When evaluating the model on both the real-world and PD Replica Sim generated datasets, we observed close performance in terms of overall mean average precision (mAP):
- Real-world mAP: 0.6434
- PD Replica Sim mAP: 0.6308
A difference of less than 2% suggests that the simulation environment is not merely a synthetic approximation but a reliable tool that can emulate real-world challenges, allowing models trained on real-world data to behave similarly in the simulated environment.


Beyond the Numbers: Failure Analysis as a Trust Indicator
Numbers alone don’t tell the whole story. A system could have similar overall performance but still fail in different ways. So, we took a closer look, analyzing not only the successes but also the failures of the model in both environments. And what we found was that, much like with the successful cases, the model failed in similar ways across both the PD Replica Sim and real-world sets. Common failure modes included:
- Occlusion: When signs were partially hidden by trees or other objects.
- Object Orientation: When signs were oriented at difficult angles for the model to handle
- Distance from Camera: When the sign was too far or too close to the camera
This consistent failure pattern provided a vital piece of evidence: PD Replica Sim was not just providing similar scores, but it was simulating conditions that led to similar challenges for the model, just like the real-world.


Subclass Performance: Consistent Relative Order
We also investigated how performance varied across the different types of signs and the relative sizes of the signs within the image frame. Instead of solely focusing on the absolute mAP values, we paid close attention to the relative performance—or rank order—across the different sign classes. This analysis revealed that the ordering of performance was consistent in both the PD Replica Sim and the real-world datasets. Specifically, the performance ranking was Speed Limit, followed by Yield, and then Stop signs.
This consistency in rank order is particularly insightful, as it provides a clear signal of how changes in model weights affect each subclass. While absolute performance numbers can fluctuate for various reasons, the relative order often remains a robust indicator of model behavior over time. Tracking this rank order allows us to monitor and understand how improvements or degradations in the model impact different sign types, making it a valuable tool for both validation and iterative model tuning.
| Experiment name | Mapillary dataset | PD Replica dataset | Real-to-Sim Relative Difference |
| General mAP score (↑ is better) | 0.6434 | 0.6308 | -1.96% |
| 1. Stop Signs mAP | 0.6945 | 0.6443 | -7.23% |
| 2. Yield Signs mAP | 0.6595 | 0.6296 | -4.53% |
| 3. Speed Limit Signs mAP | 0.5761 | 0.6184 | 7.34% |
| Large signs mAP | 0.7920 | 0.8518 | 6.29% |
| Medium signs mAP | 0.7980 | 0.8193 | 2.67% |
| Small signs mAP | 0.5851 | 0.5048 | -13.72% |
The Takeaway: A Promising Progression
Our experiments demonstrate that PD Replica Sim can produce sensor output that reflect the performance characteristics of real-world data for traffic sign detection, building upon our foundational research in parking spot detection. The close alignment of overall mAP scores, coupled with the similar failure patterns, and equal relative subclass performance paints a compelling picture: we can use PD Replica Sim to evaluate the effectiveness of our models with a higher degree of confidence with traffic signs, and gain valuable insights into model strengths and weaknesses.
This is a significant step towards validating models quickly and efficiently, even without access to large volumes of expensive real-world data. We can use the simulated data to expand the validation set, helping us to better characterize how our models will perform in more realistic situations.
Looking Ahead
This analysis is just the beginning. We have shown that we can trust the general performance of a model when evaluated on the PD Replica data, but there is still more to understand. In an upcoming post, we will dive deeper into how you can leverage PD Replica to explore specific edge cases and gather valuable insights into model behavior and improve overall performance. Additionally, we will continue our research with testing pedestrian and vehicle detection model performance, to continue our effort in systematically testing PD Replica Sim performance.
For now, we are confident that PD Replica Sim offers one of the highest levels of fidelity on the market.
To experience it yourself as part of a trial, or see a live demo, please fill out the below form:
Appendix: PD Replica Sim data generation approach and statistics
We ensured that the data we generated had a similar looking dataset statistically to real-world data. The reason is that when performances deviate between the real and simulation validation this is an indicator for:
- Label misalignment causes certain object ground truth to differ between the real-world and simulation generated datasets, thus causing systemic miss-detection by the model.
- Model sensitivity to certain color, object placement, size highlighting the limitations or bias in the model prediction.